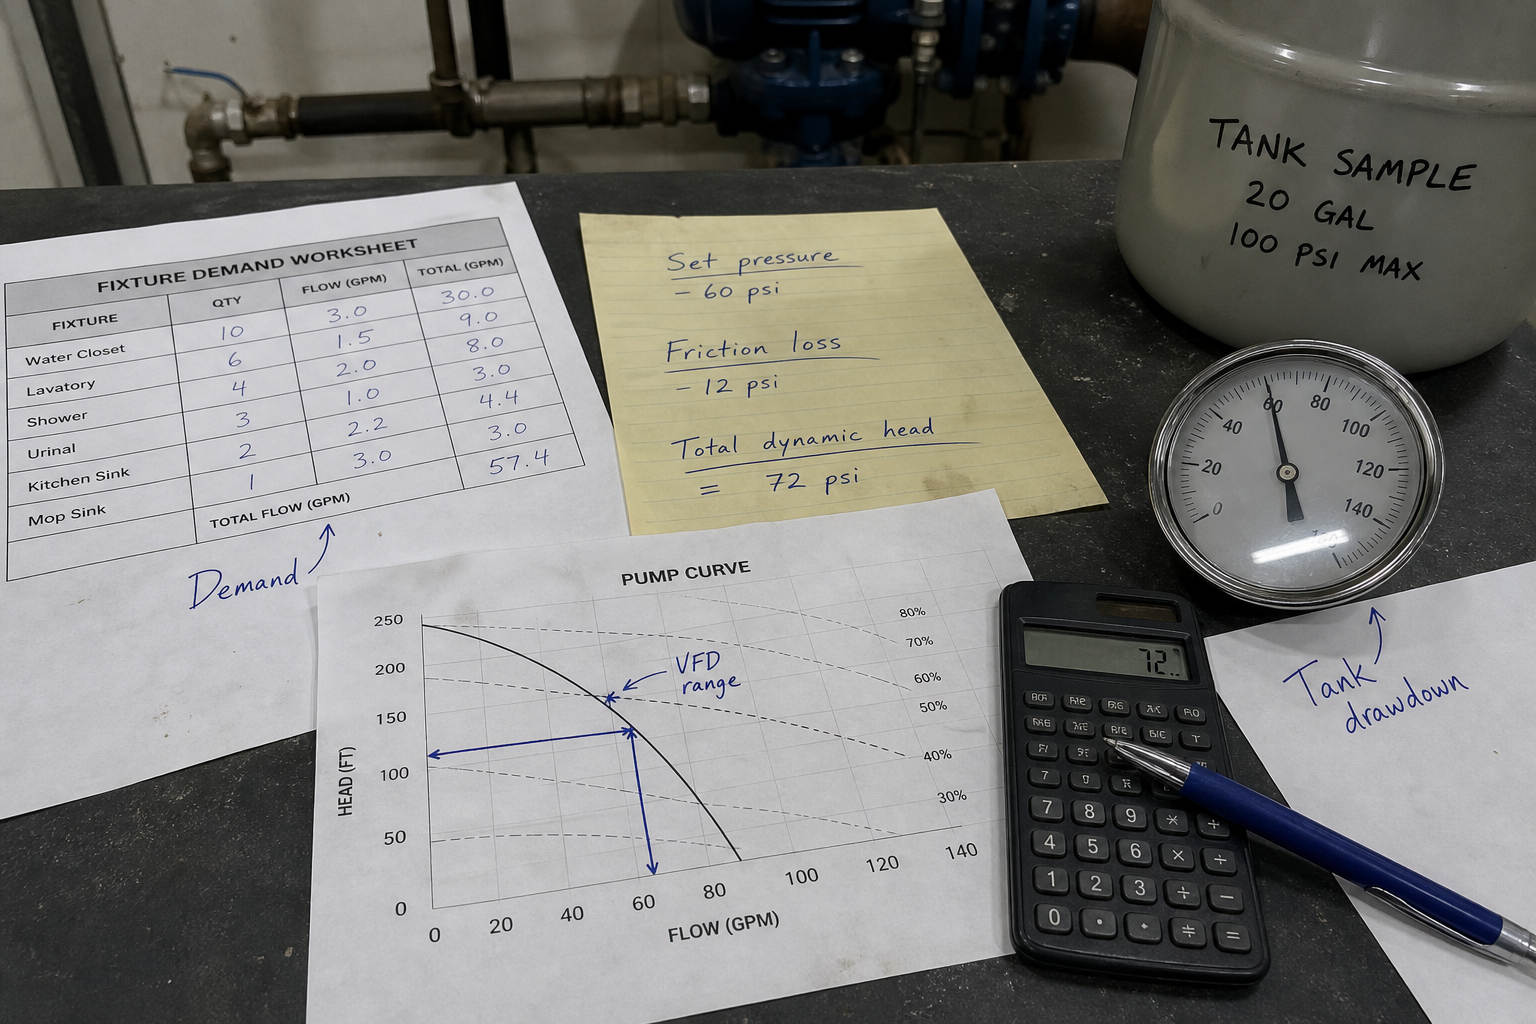
Field-style article image prepared for booster pump sizing calculator.
A booster pump sizing calculator determines the required flow rate, discharge pressure, and control strategy for pressure-boosting applications in commercial, industrial, and municipal water systems. The calculation combines peak flow demand from fixture counts or process requirements, target pressure at the critical delivery point, and total dynamic head including elevation, friction, and pressure losses. Most sizing errors occur when engineers skip the system curve analysis or fail to account for control method impact on pump selection.
During commissioning of a pharmaceutical manufacturing expansion, the booster system short-cycled every 90 seconds despite meeting nameplate flow and pressure specifications. The root cause was pressure switch deadband mismatch with pump curve characteristics. Proper sizing requires matching three parameters—flow demand, pressure target, and control range—to both the pump performance envelope and the system resistance curve.
Key Takeaways
- Booster pump sizing requires calculating total flow demand (GPM or m³/h), total dynamic head (feet or meters), and net positive suction head available at the pump inlet.
- System curve construction plots flow versus head loss; pump selection must place the duty point in the preferred operating region, typically 80-110% of best efficiency point flow.
- Control method—variable frequency drive, pressure-sustaining valve, or on-off cycling—directly affects minimum flow limits, turndown ratio, and number of pumps in the package.
- Friction loss calculations must include piping, fittings, valves, meters, and any inline equipment between pump discharge and delivery point.
Flow Demand Calculation Methods
Total flow demand equals the sum of all simultaneous loads at the design condition. For fixture-based systems, apply diversity factors from plumbing codes rather than adding all fixture unit flows directly. Industrial process systems require flow data from equipment schedules, heat exchanger duties, or spray header specifications.
The general flow equation is Q_total = Σ(Q_i × D_i), where Q_i is individual load flow and D_i is the diversity or simultaneity factor for that load group. Diversity factors typically range from 0.3-0.7 for large fixture counts and approach 1.0 for small critical process loads.
Instantaneous peak demand differs from average flow. Booster pumps must handle peak demand with adequate pressure, even if that peak occurs for only 5-10 minutes per hour.
Total Dynamic Head Determination
Total dynamic head (TDH) combines static head, friction head, and pressure head requirements. The formula is TDH = h_static + h_friction + h_pressure, where each term is expressed in consistent units—feet of head or meters of head.
Static head equals elevation difference from pump centerline to delivery point. For basement booster serving roof equipment, static head equals building height plus any below-grade pump location depth. This component remains constant regardless of flow rate.
Friction head varies with flow squared according to Darcy-Weisbach or Hazen-Williams equations. For Hazen-Williams, h_f = 4.52 × (Q^1.85) / (C^1.85 × d^4.87) × L, where Q is flow in GPM, C is roughness coefficient (typically 120-140 for commercial steel pipe), d is pipe inside diameter in inches, and L is equivalent length in feet including fittings.
Pressure head converts required delivery pressure to head units. If the delivery point needs 65 psig and suction pressure is 40 psig, the net pressure requirement is 25 psi, equivalent to 57.75 feet of head (multiply psi by 2.31 for water).
System Curve Construction and Duty Point Selection
The system curve plots TDH versus flow rate across the operating range. Static head forms the y-intercept, and friction losses create the parabolic curve shape. Accurate system curve construction requires calculating friction head at minimum flow, design flow, and maximum anticipated flow.
Plot the system curve on the same axes as candidate pump curves from manufacturer data. The duty point occurs where system curve intersects pump curve at design flow. This intersection must fall within the pump’s preferred operating region—typically between 80% and 110% of best efficiency point (BEP) flow.
Operating consistently outside this region causes excessive wear, cavitation risk, or efficiency penalties. For variable demand applications, verify that both minimum and maximum flow duty points remain within acceptable operating range.
Net Positive Suction Head Requirements
Net positive suction head available (NPSHA) must exceed net positive suction head required (NPSHR) by a safety margin, typically 3-5 feet minimum. NPSHA depends on supply pressure, elevation difference between supply and pump inlet, and suction piping friction losses.
The formula is NPSHA = P_supply + h_static – h_friction – h_vapor, where P_supply is supply pressure in feet absolute, h_static is elevation contribution (positive if supply is above pump), h_friction is suction line losses, and h_vapor is vapor pressure of the pumped fluid at operating temperature.
Most booster pump applications receive supply from a municipal main or storage tank with adequate positive pressure, making NPSHA comfortably above NPSHR. Verify NPSHA at maximum flow condition when suction friction losses reach their peak.
Control Method Impact on Pump Selection
Variable frequency drives (VFDs) modulate pump speed to maintain constant discharge pressure across varying demand. VFD control allows single-pump or multi-pump systems to achieve turndown ratios of 10:1 or higher while maintaining efficiency.
On-off cycling with pressure switches suits applications with limited flow variation or large storage volume between pump and demand. The pressure switch differential (cut-in minus cut-out) must be wide enough to prevent rapid cycling but narrow enough to maintain acceptable pressure variation at fixtures.
Pressure-sustaining valves throttle pump discharge to maintain setpoint pressure. This method wastes energy as throttling losses and offers no turndown efficiency benefit, but it provides simple control without electrical variable speed equipment.
Multi-pump packages staging pumps based on demand offer redundancy and improved part-load efficiency. Staging logic adds pumps as pressure drops below setpoint and removes pumps as pressure stabilizes above setpoint with built-in time delays.
Minimum Flow and Bypass Protection
Centrifugal pumps operating below minimum continuous flow experience temperature rise, recirculation, and mechanical damage. Pump curves specify minimum flow as a percentage of BEP flow, typically 20-40% depending on specific speed and impeller type.
If system demand can drop below pump minimum flow, install a bypass line with flow control valve returning discharge fluid to the suction source. Size the bypass to maintain minimum flow when system demand approaches zero. The bypass valve may be manually set or automatically controlled via flow meter signal.
Temperature rise at shutoff (zero flow) can be estimated from ΔT = (H × 3.03) / (t × Cp), where H is shutoff head in feet, t is time in minutes, and Cp is specific heat. For water, this simplifies to approximately 10-15°F rise per minute for typical booster pumps at shutoff.
Motor Sizing and Safety Margin
Motor horsepower must cover maximum power draw across the pump’s operating range. Power required equals (Q × TDH × SG) / (3,960 × η), where Q is flow in GPM, TDH is total dynamic head in feet, SG is specific gravity, and η is pump efficiency as a decimal.
Many centrifugal pumps reach peak power at flows higher than BEP, creating a non-overloading versus overloading power curve distinction. Non-overloading curves show maximum power at shutoff; overloading curves show maximum power at runout flow. Verify the motor can handle maximum power anywhere on the curve.
Apply a service factor of 1.15-1.25 to calculated power to account for voltage variation, altitude derating, and startup transients.
Installation Configuration Considerations
Parallel pump installation divides flow between multiple pumps operating simultaneously at the same discharge pressure. Series installation stacks discharge heads to achieve higher total pressure than a single pump can deliver. Booster packages typically use parallel configuration for redundancy and flow capacity.
When plotting parallel pump operation, add flow values at each head; the combined curve extends horizontally from the single-pump curve. Ensure each pump’s duty point remains in the preferred zone when one pump is off for maintenance.
Suction piping configuration affects NPSHA and pump reliability. Avoid elbows immediately upstream of the pump inlet; maintain at least five pipe diameters of straight suction piping. Install suction strainers or filters to protect impellers from debris, particularly during initial startup of new piping systems.
FAQs
What information do I need before using a booster pump sizing calculator?
You need peak flow demand in GPM or m³/h, required delivery pressure at the critical point, supply pressure at the pump suction, elevation difference from pump to delivery point, total piping length with fitting list, and fluid properties including temperature and specific gravity. You also need to specify control method preference and whether redundancy is required.
How do I account for future expansion in booster pump sizing?
Size piping and select pump casing for future flow, but install an impeller trimmed for current demand. Most pump casings accept multiple impeller diameters, allowing field upgrades without replacing the entire pump. VFD-controlled systems handle increased demand up to motor nameplate power limit by allowing the pump to operate at higher speeds.
Can I use the same sizing method for sanitary or chemical applications?
The hydraulic calculations remain the same, but material selection, seal types, and cleanability requirements differ significantly. Sanitary applications require 3-A certified pumps with specific surface finishes and clean-in-place compatibility. Chemical applications require elastomer and metallurgy compatibility verification for the specific fluid, and often require different NPSHR margins due to vapor pressure or viscosity effects.
Why does my booster pump cycle frequently even though it meets flow and pressure specs?
Frequent cycling indicates inadequate system volume between pump and demand, pressure switch deadband too narrow for the pump’s flow variation per cycle, or check valve leakage allowing backflow. Increase system volume with a hydropneumatic tank, widen the pressure switch differential, or verify check valve seating to resolve cycling issues.
Conclusion
Booster pump sizing requires calculating flow demand with appropriate diversity factors, total dynamic head including all system components, and NPSHA verification at maximum flow conditions. Match the duty point to a pump curve placing operation between 80-110% of BEP flow, select a control method compatible with the demand profile, and verify motor sizing covers maximum power draw across the full operating range. Before commissioning, confirm that pressure switch settings or VFD pressure transducer calibration align with the calculated duty point and that bypass protection maintains minimum continuous flow when system demand drops below pump limits.