
A pump moving 100 gallons per minute against 80 feet of head may show 65% efficiency on the manufacturer’s curve, yet the motor nameplate tells you the system draws 2.5 kilowatts—implying only 48% wire-to-water efficiency. Both numbers are correct because they measure different boundaries: the first compares hydraulic output to shaft input, while the second includes motor and drive losses. Pump efficiency calculation gives you the conversion factor between useful hydraulic work and the energy you pay for, but you must define which input and output boundaries you are measuring before you plug numbers into a formula.
This guide defines the three efficiency boundaries—hydraulic output power, pump shaft efficiency, and wire-to-water efficiency—shows how to calculate each from flow, head, power, and density measurements, works through a complete example with unit conversions, and explains how measurement error, off-design operation, and density changes alter calculated efficiency without signaling a mechanical fault.
Key Takeaways
- Pump efficiency compares hydraulic output power (flow × head × density) to mechanical or electrical input power; specify whether you measure shaft input or motor input
- Hydraulic power in watts equals (flow in m³/s) × (head in meters) × (density in kg/m³) × (9.81 m/s²); in horsepower it equals (flow in gpm) × (head in feet) × (specific gravity) ÷ 3,960
- Pump efficiency is hydraulic power divided by shaft power; wire-to-water efficiency is hydraulic power divided by motor input power and accounts for both pump and motor losses
- Operating away from best efficiency point lowers measured efficiency even when the pump is mechanically sound—compare calculated values to the manufacturer’s curve at the actual flow rate
- Density changes with temperature and dissolved solids; recalculate hydraulic power with the true pumped-liquid density or specific gravity when the fluid differs from the curve-test value
- Verify flow, head, and power measurements before diagnosing efficiency loss—a 5% flow-meter error can shift calculated efficiency by 5 percentage points
Define Which Efficiency Boundary You Are Calculating
Efficiency has three boundaries in pump systems, and mixing them produces contradictory diagnostics. Hydraulic power is the useful work delivered to the fluid—flow rate times head times fluid weight. Pump efficiency compares hydraulic power to the mechanical power entering the pump shaft, isolating losses inside the pump casing, impeller, wear rings, and mechanical seal. Wire-to-water efficiency compares hydraulic power to the electrical power entering the motor, combining pump losses and motor losses into one number that directly predicts your electricity bill.
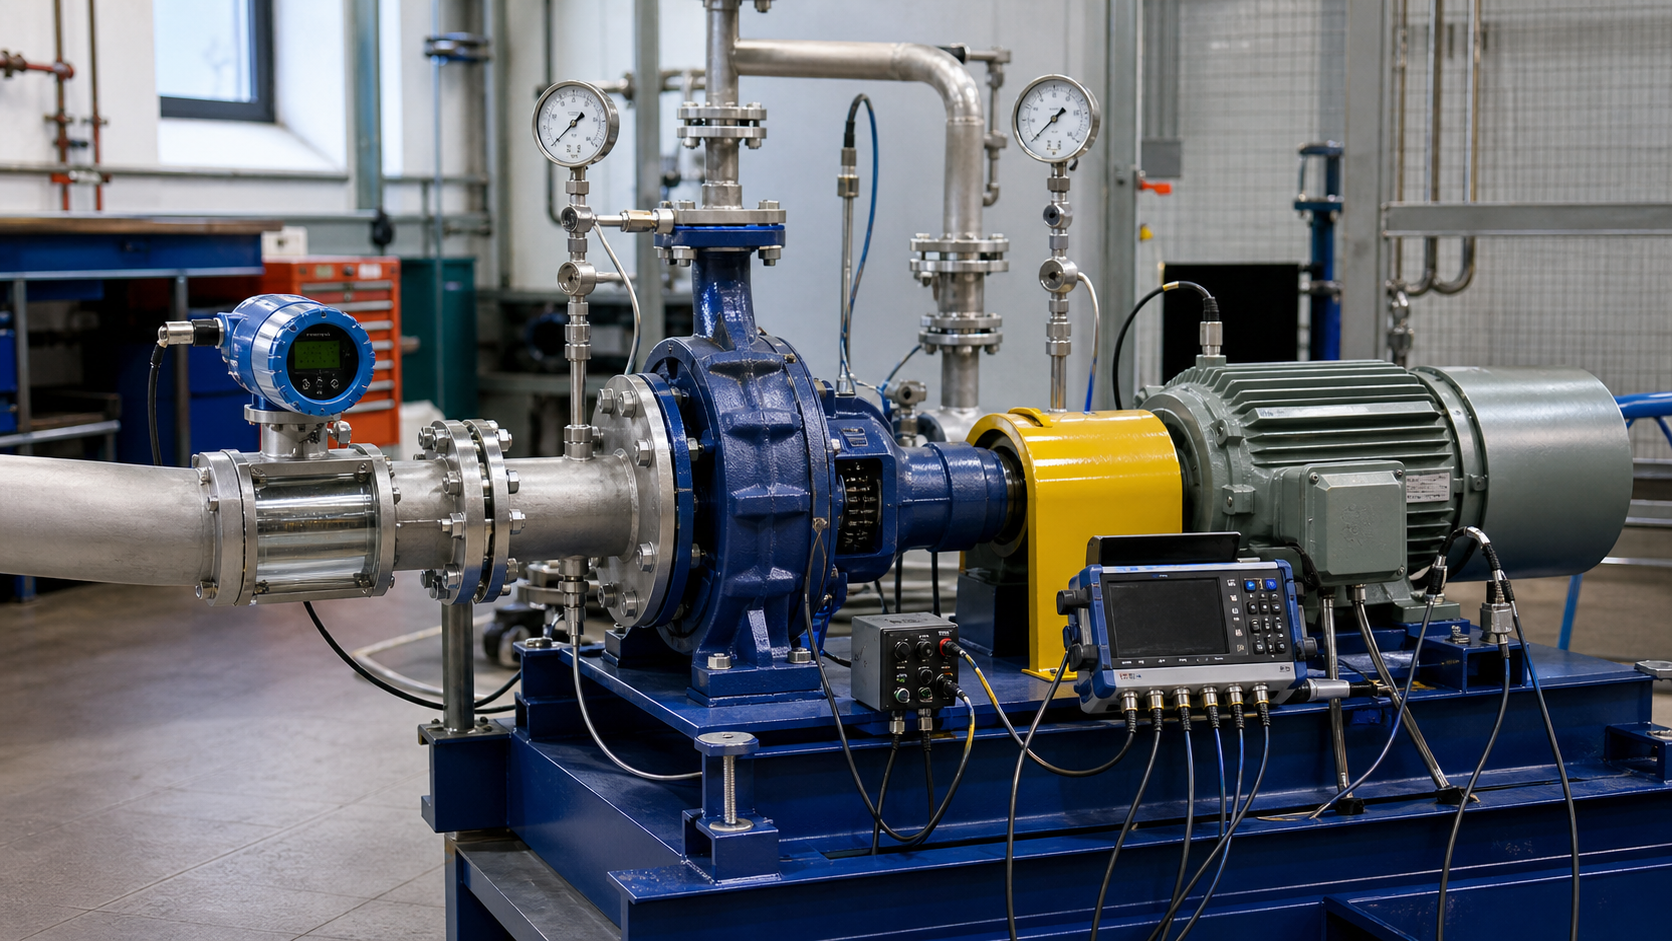
Plant instruments measure different points on this chain. A clamp-on flow meter and two pressure gauges give you hydraulic power. A torque sensor or dynamometer on the shaft between motor and pump gives you shaft power, letting you calculate pump efficiency alone. A power meter on the motor supply cable gives you wire-to-water efficiency. Most facilities have only the flow, pressure, and motor-input measurements, so wire-to-water efficiency is the number you calculate from field data, then you subtract typical motor efficiency (read from the motor nameplate or test report) to estimate pump efficiency.
When you compare your calculated efficiency to the manufacturer’s pump curve, verify that the curve shows pump efficiency (shaft basis) or overall efficiency (motor basis). Centrifugal pump curves nearly always plot pump efficiency, so if you calculated wire-to-water efficiency from motor input, you must add back the motor loss before comparing to the curve.
Hydraulic Output Power from Flow and Head
Hydraulic power is the rate of energy transfer to the fluid. In SI units:
P_hydraulic = Q × H × ρ × g
Where:
- P_hydraulic = hydraulic power (watts, W)
- Q = volumetric flow rate (cubic meters per second, m³/s)
- H = total dynamic head (meters, m)
- ρ = fluid density (kilograms per cubic meter, kg/m³)
- g = gravitational acceleration (9.81 m/s²)
For water at 20°C, density is approximately 998 kg/m³.
In US customary units:
P_hydraulic (hp) = (Q × H × SG) / 3,960
Where:
- P_hydraulic = hydraulic power (horsepower, hp)
- Q = flow rate (gallons per minute, gpm)
- H = total dynamic head (feet, ft)
- SG = specific gravity (dimensionless, water = 1.0)
- 3,960 = conversion constant incorporating water density, gravitational acceleration, and unit conversions
When pumping liquids other than water, use the actual specific gravity measured at pumping temperature. For sewage or process fluids with dissolved solids, specific gravity may differ from 1.0, changing hydraulic power proportionally at constant flow and head.
Total dynamic head H is the difference in total pressure energy between discharge and suction, expressed as an equivalent column height of the pumped fluid. Convert gauge pressures to head using H = (P_discharge – P_suction) / (ρ × g) in SI or H = (P_discharge – P_suction) × 2.31 / SG in US units (with pressure in psi). Add static elevation difference when calculating from pressure gauges mounted at different elevations.
Pump Shaft Power and Pump Efficiency Formula
Shaft power is the mechanical power delivered to the pump shaft by the driver, measured in watts or horsepower. Pump efficiency compares hydraulic output to shaft input:
η_pump = P_hydraulic / P_shaft
Expressed as a percentage: η_pump (%) = (P_hydraulic / P_shaft) × 100
Shaft power typically comes from one of three measurements:
- Dynamometer or torque sensor: P_shaft = (2π × n × T) / 60 in SI (power in watts, speed n in rpm, torque T in newton-meters), or P_shaft = (n × T) / 5,252 in US units (power in horsepower, torque in pound-feet)
- Motor input and motor efficiency: P_shaft = P_motor × η_motor. Read motor efficiency from the nameplate or manufacturer curve at the measured load
- Manufacturer pump curve: When no shaft measurement exists, read required shaft power from the pump curve at the measured flow and head
Pump efficiency peaks at best efficiency point (BEP), then falls at higher and lower flows. Compare your calculated efficiency to the curve at the actual operating flow rate, not to the BEP value alone.
Motor Input and Wire-to-Water Efficiency
Wire-to-water efficiency combines pump and motor losses:
η_wire-to-water = P_hydraulic / P_motor_input
Where P_motor_input is electrical power measured at motor terminals (watts or kilowatts).
You can factor wire-to-water efficiency into pump and motor components:
η_wire-to-water = η_pump × η_motor
Motor efficiency depends on load. When a pump operates at partial flow due to throttling or system changes, both pump efficiency and motor efficiency fall, compounding the wire-to-water loss. Variable frequency drives add losses between motor input and the power meter, so account for VFD efficiency separately if your power measurement is upstream of the drive.
Worked Water-Pump Example with Unit Conversion
Given data:
- Flow rate: Q = 120 gpm
- Suction pressure gauge: 5 psig (at pump centerline)
- Discharge pressure gauge: 68 psig (1 foot above suction gauge)
- Fluid: clean water at 70°F, SG = 1.0
- Motor input power (measured): P_motor = 7.2 kW
- Motor nameplate efficiency at this load: η_motor = 89%
Calculate total dynamic head:
Pressure difference: ΔP = 68 – 5 = 63 psi
Convert to feet of head: H_pressure = ΔP × 2.31 / SG = 63 × 2.31 / 1.0 = 145.5 ft
Since the discharge gauge is 1 foot higher, the fluid gains 1 foot of elevation between gauges, which is already included in the pressure difference. Total dynamic head H = 145.5 ft.
Calculate hydraulic power:
P_hydraulic = (Q × H × SG) / 3,960
P_hydraulic = (120 × 145.5 × 1.0) / 3,960 = 4.41 hp
Convert to kilowatts: P_hydraulic = 4.41 hp × 0.746 kW/hp = 3.29 kW
Calculate wire-to-water efficiency:
η_wire-to-water = P_hydraulic / P_motor_input = 3.29 kW / 7.2 kW = 0.457 = 45.7%
Calculate pump shaft power and pump efficiency:
P_shaft = P_motor × η_motor = 7.2 kW × 0.89 = 6.41 kW
η_pump = P_hydraulic / P_shaft = 3.29 kW / 6.41 kW = 0.513 = 51.3%
Interpretation: Wire-to-water efficiency is 45.7%. Pump efficiency is 51.3%. Check the manufacturer’s pump curve at 120 gpm and 145.5 ft to determine whether this efficiency is expected at this operating point or indicates wear.
Measurement Error, Density, and Operating-Point Effects
Calculated efficiency is only as accurate as your input measurements. A 5% flow-meter error produces a 5% hydraulic power error and a 5% efficiency error. Pressure gauge errors compound when subtracting suction from discharge.
Common measurement problems include:
- Pressure gauge elevation correction ignored: A discharge gauge mounted above the pump discharge nozzle reads lower than the true discharge pressure at the nozzle. Always reference gauge readings to the same elevation
- Flow meter calibration drift: Magnetic flow meters, turbine meters, and ultrasonic meters drift with time, scaling, and fluid properties. Verify flow-meter calibration periodically
- Power meter location: Measured input location determines which losses are included
- Specific gravity assumption wrong: Using the wrong specific gravity in the formula produces proportional hydraulic power and efficiency errors
Density correction example: If the worked example above pumps hot water at 90°C (SG = 0.965) instead of cold water:
P_hydraulic = (120 × 145.5 × 0.965) / 3,960 = 4.25 hp = 3.17 kW
η_wire-to-water = 3.17 / 7.2 = 44.0%
η_pump = 3.17 / 6.41 = 49.5%
The specific gravity change reduces calculated efficiency by approximately 2 percentage points.
Operating away from BEP also changes efficiency. As flow increases beyond BEP, internal recirculation and shock losses grow; as flow decreases below BEP, leakage past wear rings and disk friction become larger fractions of input power. Both directions reduce efficiency. Always obtain the manufacturer’s full pump curve (efficiency, head, and power versus flow) to separate operating-point effects from mechanical degradation.
Use Efficiency Trends without Misdiagnosing the System
Tracking efficiency over time reveals pump wear, but only when you normalize for operating point and fluid properties. Log flow, head, power, and temperature periodically, then plot calculated efficiency against flow rate. A horizontal downward shift of the efficiency curve (lower efficiency at every flow) indicates wear ring clearance growth, impeller damage, or seal leakage.
Do not diagnose pump wear from a single efficiency calculation unless you verify:
- Flow, head, and power measurements are accurate and taken simultaneously during stable operation
- Fluid density matches the calculation—check temperature and specific gravity
- The pump is operating within its published curve range, not deadheaded, cavitating, or running dry
- System resistance has not changed—a partially closed valve or fouled strainer changes the operating point without damaging the pump
When efficiency falls below the curve prediction and measurements are verified, inspect internal clearances. Wear ring clearance growth is the most common efficiency loss mechanism. Measure clearances during the next maintenance shutdown and compare to the manufacturer’s maximum allowable limits.
For energy audits and optimization, compare wire-to-water efficiency across similar pumps. A system with multiple identical pumps should show similar wire-to-water efficiencies. One pump with significantly lower efficiency may have excessive wear, wrong impeller trim, motor inefficiency, or be fighting a closed valve. Investigate the outlier before replacing components, because often the problem is system configuration, not the pump itself.
FAQs
Why does my calculated pump efficiency exceed 100%?
Efficiency above 100% is physically impossible and indicates a measurement or calculation error. Common causes include: pressure gauges reading high due to calibration drift; flow meter reading low due to scaling or incorrect sizing; using the wrong specific gravity; or reading motor input power incorrectly (confusing apparent power in kVA with real power in kW). Verify all instrument calibrations and recheck unit conversions.
Can I use pump efficiency to compare different pump models?
Only when comparing at the same specific speed, flow range, and application. A high-speed centrifugal pump and a positive displacement pump serve different duties and are not directly comparable by efficiency alone. Among centrifugal pumps, larger pumps typically achieve higher efficiency than smaller pumps, both well-designed for their size. For selection decisions, calculate total cost of ownership over the pump’s life rather than choosing solely by peak efficiency.
How do I calculate efficiency when the pump has multiple stages?
The formulas remain the same. Total dynamic head is the sum of all stage heads, and hydraulic power is calculated using total head. The efficiency calculation treats the pump as a single unit from suction to discharge. You cannot easily isolate individual stage efficiency without measuring inter-stage pressures.
What is the minimum acceptable pump efficiency for replacement decisions?
Replacement thresholds depend on operating hours, energy cost, and pump capital cost. Calculate the annual energy cost difference between current and new efficiency, then compare to the capital cost of replacement. Verify that the efficiency loss is due to pump wear and not an operating-point shift before spending capital.
How does cavitation affect calculated efficiency?
Cavitation reduces both head and efficiency, but calculated efficiency may show less degradation than actual pump damage suggests because you measure reduced head output and reduced power input simultaneously. Monitor NPSH margin, suction pressure, and noise separately from efficiency calculations—cavitation is identified by rapid fluctuations in discharge pressure and flow, not by efficiency alone.
Conclusion
Pump efficiency calculation starts with defining the boundary—hydraulic output compared to shaft input gives pump efficiency; compared to motor input gives wire-to-water efficiency—then measuring flow, head, and power accurately with instruments calibrated to the actual fluid density and operating conditions. For the 120 gpm, 145.5 ft, 7.2 kW motor input example, the 45.7% wire-to-water efficiency and 51.3% pump efficiency both correctly describe the energy conversion but require the manufacturer’s pump curve at the actual operating point to confirm whether the pump is worn or simply running off-design. Record baseline efficiency at commissioning with verified instruments and the manufacturer curve in hand, then track efficiency trends against flow rate to separate mechanical wear from system changes before scheduling repairs or replacements.
Further reading: