
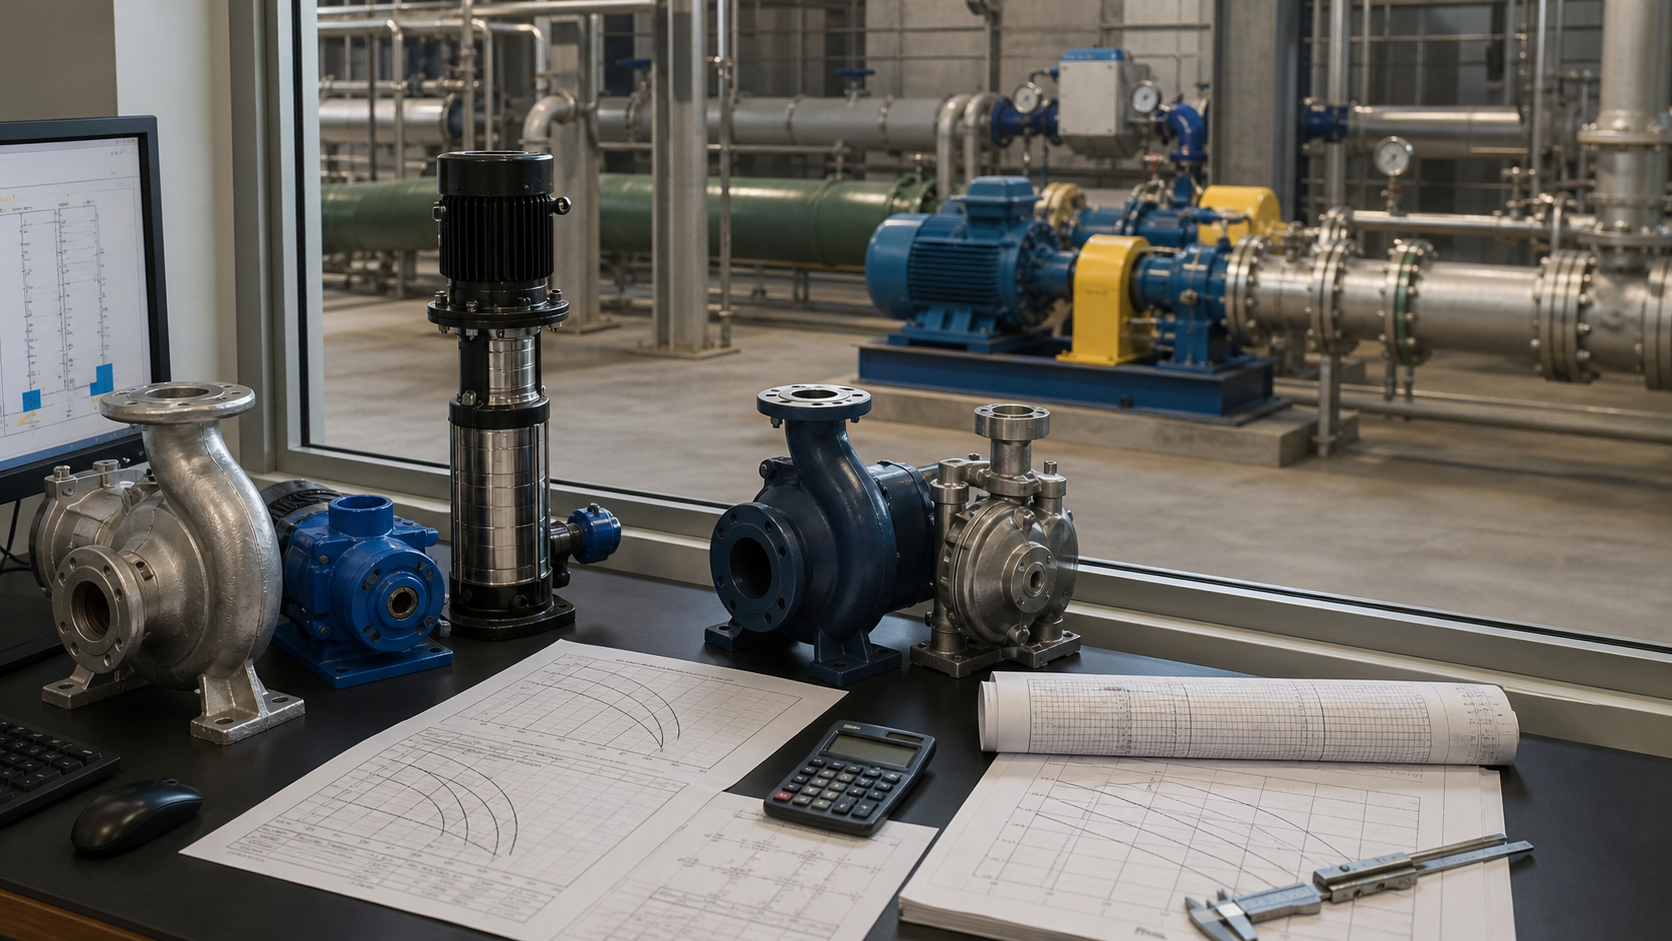
A plant engineer selects a 3-inch pump to match the suction line diameter. The system starts, delivers 60 GPM instead of the required 150 GPM, and cavitates at the inlet. The pipe size matched, but the pump was never compared to the system curve or the actual duty point. Pump sizing calculation converts process flow requirements and piping system resistance into a pump duty, then selects an impeller and casing that place the operating point near best efficiency across the expected operating range.
Key Takeaways
- Size the pump to the system curve and duty point, not to the pipe diameter or a single flow rate.
- Build the system head curve at three or more flow rates to capture friction losses that scale with velocity squared.
- Correct the pump curve for density, viscosity, temperature, and entrained gas or solids before verifying the intersection.
- Verify that NPSHa exceeds NPSHr by the manufacturer’s required margin at maximum flow, and that driver power covers the full operating range.
- Document flow, head, fluid properties, NPSH, power, speed, and operating envelope on a pump sizing data sheet before requesting quotations.
Start with the Required Flow Profile
Required flow rate is the volumetric or mass flow the pump must deliver to the process or system. Define flow at normal operating duty, minimum continuous flow, maximum expected flow, and any future expansion condition. Recording only a single design flow hides whether the pump can modulate down during low demand or handle increased production without exceeding its operating envelope.
Express flow in consistent units throughout the calculation. US industrial practice uses gallons per minute (GPM) or million gallons per day (MGD) for water and wastewater; barrels per day (BPD) for petroleum; cubic meters per hour (m³/h) in metric systems. Convert mass flow to volumetric flow using fluid density at operating temperature:
Q = ṁ / ρ
where Q is volumetric flow, ṁ is mass flow rate, and ρ is fluid density.
Establish the flow profile by checking process requirements, hydraulic loading rates, cooling duties, or transfer schedules. Document the source of each flow value—process simulation, piping and instrumentation diagram, equipment data sheet, or measured operating data—so the assumption can be traced during commissioning or troubleshooting.
Worked example: A cooling tower recirculation system requires 800 GPM at full load, 400 GPM at minimum cooling demand, and is planned for 1,000 GPM expansion within three years. All three flow rates enter the sizing calculation to verify stable operation across the range.
Build the System Head at More Than One Flow
Total dynamic head (TDH) is the energy the pump must add to move liquid through the system at a given flow rate. It combines static head, friction head, and velocity head. System head changes with flow because friction losses scale with velocity squared, making the system curve parabolic rather than flat.
TDH = H_static + H_friction + H_velocity + H_equipment
Static head is the elevation difference between the liquid source and discharge point, plus any pressure difference between the two surfaces. It remains constant across all flow rates. For a pressurized system, convert pressure to head using:
H_pressure = (P_discharge – P_suction) / (ρ × g)
where P is absolute pressure, ρ is density, and g is gravitational acceleration.
Friction head comes from pipe walls, fittings, valves, and changes in diameter. Calculate friction losses using the Darcy-Weisbach equation or Hazen-Williams method for each pipe segment, then sum all losses:
H_friction = f × (L/D) × (v²/2g)
where f is the friction factor, L is pipe length, D is diameter, and v is flow velocity. Friction head increases with the square of velocity, so a system curve built at only one flow rate will under-predict head at higher flows and over-predict at lower flows.
Velocity head is the kinetic energy at the discharge point:
H_velocity = v²/2g
Equipment head includes losses through heat exchangers, filters, control valves at their design position, and other in-line devices. Obtain these values from equipment manufacturers at the expected flow rates.
Calculate system head at minimum flow, design flow, and maximum flow to define the curve. For the 800 GPM cooling water example with 40 feet static head, 8 feet friction loss at 800 GPM, and 18 feet friction loss at 1,000 GPM (scaling by flow squared), the system curve becomes:
Flow (GPM) | Static (ft) | Friction (ft) | TDH (ft) |
|---|---|---|---|
400 | 40 | 2 | 42 |
800 | 40 | 8 | 48 |
1,000 | 40 | 18 | 58 |
Plot the Duty Point and Operating Envelope
The duty point is the intersection of the pump curve and the system curve. It defines the actual flow and head the pump will deliver when installed. A pump selected without plotting this intersection may run far from its best efficiency point (BEP), leading to high energy cost, reduced life, or mechanical failure.
Obtain the pump curve from the manufacturer, showing head versus flow at the specified impeller diameter and speed. Modern curves also indicate efficiency, power, and NPSHr at each flow point. Overlay the system curve on the pump curve to find the intersection. The operating point should fall near BEP to avoid recirculation, vibration, and excessive thrust loads. Consult the manufacturer’s certified curve for the acceptable operating range.
The operating envelope is the range between minimum continuous flow and maximum flow where the pump operates stably. Minimum continuous flow is set by thermal limits or hydraulic stability. Maximum flow is limited by NPSH requirements, driver power, or the end of the stable pump curve before the head drops steeply.
For the cooling water example, select a pump with a BEP near 800 GPM and verify that the curve intersects the system curve at 48 feet of head at 800 GPM, can modulate down to 400 GPM without dropping below minimum continuous flow, and can reach 1,000 GPM at 58 feet without cavitation or exceeding motor nameplate power.
If the selected pump curve does not intersect the system curve at the required duty point, choose a different pump model, change the impeller diameter, adjust the operating speed, or re-evaluate the system design.
Correct for Density, Viscosity, Temperature, Gas, and Solids
Pump curves published by manufacturers assume clean water at ambient temperature. When pumping fluids with different density, viscosity, temperature, or entrained phases, correct the curve before verifying the duty point.
Density affects head measurement and power consumption but not the hydraulic energy added by the impeller. A pump curve in feet of head remains valid for any density, but the pressure change and power requirement scale with density:
P_pressure = H × ρ × g
Power = (Q × H × ρ × g) / η
where η is pump efficiency. Doubling density doubles the pressure rise and the power draw at the same flow and head. For a pump handling brine at specific gravity 1.2, the required motor power is 20% higher than for fresh water at the same duty point.
Viscosity reduces pump performance. As viscosity increases, friction losses inside the pump increase, reducing head, flow, and efficiency. For elevated viscosities, apply correction factors from the Hydraulic Institute charts or the pump manufacturer’s viscosity correction curve. Confirm the corrected curve still intersects the system curve at an acceptable duty point.
Temperature changes vapor pressure, affecting NPSH available. Higher temperature reduces the margin between system pressure and vapor pressure, increasing cavitation risk. Calculate NPSHa at maximum expected temperature and verify it exceeds NPSHr with the manufacturer’s recommended margin.
Entrained gas reduces effective density and can cause the pump to lose prime or gas-lock. Limit suction line velocity to prevent gas separation, vent high points in the piping, and consider self-priming or gas-handling impeller designs if entrained air is unavoidable. Entrained solids require increased clearances, abrasion-resistant materials, and reduced operating speed. For wastewater with solids, select pumps with open impellers or vortex designs and verify minimum solids passage diameter against the manufacturer’s specification.
Check NPSH, Power, Speed, and Driver Margin
Net positive suction head available (NPSHa) must exceed net positive suction head required (NPSHr) to prevent cavitation. Calculate NPSHa from the suction system:
NPSHa = (P_atm / ρg) + H_static_suction – H_friction_suction – (P_vapor / ρg)
where P_atm is atmospheric or surface pressure, H_static_suction is the elevation of the liquid surface above the pump centerline (positive) or below (negative), H_friction_suction includes all suction piping losses, and P_vapor is the liquid vapor pressure at operating temperature. Compare NPSHa to the pump’s NPSHr at maximum flow. Maintain the margin specified by the manufacturer.
If NPSHa is insufficient, raise the liquid source, lower the pump installation, reduce suction piping friction, or select a pump with lower NPSHr. Never ignore an NPSH shortfall—the pump will cavitate, erode, and fail prematurely.
Calculate brake horsepower at maximum flow, minimum flow, and design flow. For centrifugal pumps, power increases as flow increases. The driver must cover the full operating range without exceeding nameplate rating. Verify driver service factor and any belt-drive losses with the motor manufacturer.
BHP = (Q × H × SG) / (3960 × η)
for US units (GPM, feet, and horsepower), where SG is specific gravity and η is pump efficiency as a decimal.
Operating speed affects pump performance through the affinity laws. Increasing speed increases flow, head, and power. Verify that the selected speed keeps the pump within its mechanical limits (shaft stress, bearing load, critical speed) and that a variable frequency drive (VFD) covers the expected modulation range if installed.
Select Pump Type and Impeller Diameter
Pump type follows from the duty point, fluid properties, and installation constraints. Centrifugal pumps dominate industrial water service for moderate flow and head ranges. End-suction models suit skid mounting and small flows; split-case models handle larger capacities and allow in-place maintenance; vertical turbine or submersible designs suit deep wells or wet pits. Positive displacement pumps suit high viscosity, low flow, or precise metering applications.
Select impeller diameter to place the duty point near BEP. Manufacturers offer multiple impeller diameters for a single casing, allowing fine-tuning of the pump curve. Trimming the impeller reduces head and shifts the curve downward; installing a larger diameter increases head. The maximum impeller diameter is limited by casing size and motor power. Document the selected diameter on the data sheet so replacement impellers match the original design.
For the cooling-water example, the engineer would now compare certified manufacturer curves at the calculated duty points. The selected casing, speed, and impeller diameter must place normal and future operating conditions inside the manufacturer’s approved operating envelope without exceeding driver power or NPSH limits. A specific diameter cannot be chosen from flow and head alone without those curves.
Avoid over-sizing. A pump with excessive head capacity will operate at low flow, throttling the discharge valve to meet system head and wasting energy. A pump with excessive flow capacity will operate near runout conditions where NPSHr increases and shaft loads spike.
Verify Minimum Flow, Control Method, and Future Conditions
Minimum continuous flow protects the pump from overheating, recirculation, and mechanical damage during low-demand periods. Confirm that the minimum operating flow remains above the manufacturer’s minimum continuous flow limit. If turndown below this limit is required, install a recirculation line with a pressure-relief or flow-control valve to maintain minimum flow through the pump while excess flow bypasses back to the suction source.
Control method affects the operating point. Throttling a discharge valve increases system head and moves the operating point left along the pump curve, reducing flow and efficiency. A VFD reduces pump speed, shifting the entire pump curve downward and maintaining operation near BEP across the flow range. VFD control is more energy-efficient for variable-flow applications but adds cost and requires motor compatibility. Throttle control is simpler and adequate for narrow operating ranges.
Verify the selection against future conditions. If the system will add parallel piping, increase static head, or expand flow requirements, confirm that the pump can accommodate the change by adjusting impeller diameter, speed, or parallel/series staging. Document the design margin so future engineers understand how much capacity remains.
Pump Sizing Data Sheet before Quotation
A complete pump sizing data sheet records every value used in the selection. It serves as the specification for quotation, the baseline for commissioning, and the reference for future troubleshooting. At minimum, the data sheet must include:
- Liquid name, temperature range, specific gravity, viscosity, vapor pressure, and solids content
- Flow rates: normal, minimum, maximum, and future
- Total dynamic head at each flow rate, with static and friction components listed separately
- Suction conditions: pressure or liquid level, piping size, NPSHa
- Discharge conditions: pressure or elevation, piping size
- Pump type, orientation, materials of construction
- Impeller diameter and operating speed
- Driver type, power, voltage, enclosure
- Minimum continuous flow and control method
- Applicable standards and codes
Attach the system curve, selected pump curve, and any correction factors or special requirements. Manufacturers use this data sheet to verify that the quoted pump meets the duty and to flag any mismatches before fabrication.
A sizing data sheet also simplifies procurement when multiple vendors quote. Each vendor responds to the same specification, making technical comparison straightforward. For projects with multiple pumps, create a separate data sheet for each service.
FAQs
What happens if I size a pump using only the pipe diameter?
Pipe diameter sets flow velocity but does not define the system curve or the pump duty point. A pump matched to pipe size may deliver far more or far less flow than required, depending on where the pump curve intersects the actual system head. Always calculate the duty point from system requirements and piping head loss, then select the pump to meet that duty regardless of pipe size.
Can I use a pump curve generated for water when pumping other liquids?
The pump curve in feet of head applies to any liquid because the impeller adds the same energy per unit mass regardless of density. However, pressure rise scales with density, power scales with density, and viscosity corrections reduce head, flow, and efficiency for viscous liquids. Use the published water curve for head and flow, then correct for density when calculating pressure and power, and apply viscosity correction factors when required. Do not use the water curve directly for slurries with high solids content—consult the manufacturer for slurry-specific performance.
How do I size a pump when the system curve is unknown?
If the system piping does not yet exist or is poorly documented, estimate friction losses using standard pipe sizing methods and add contingency to the calculated head. Measure existing system performance if the pump is a replacement—record flow, suction pressure, and discharge pressure at multiple operating points to back-calculate the system curve. For new installations, calculate friction losses for the longest expected piping run at maximum flow, then verify the selection once final piping drawings are available.
Should I include future expansion flow when sizing the pump now?
Include future expansion only if it will occur within the expected pump service life and the timing is reasonably certain. Sizing for hypothetical future loads over-sizes the pump for current operation, reducing efficiency and increasing capital cost. A better approach is to select a pump near BEP for current duty with documented margin, then plan for impeller diameter increase, speed adjustment, or parallel pump addition when expansion occurs.
What is the consequence of insufficient NPSH margin?
Insufficient NPSHa causes cavitation—vapor bubbles form at the impeller inlet, then collapse violently as pressure increases inside the impeller. Cavitation erodes impeller and casing surfaces, produces noise and vibration, and reduces pump head and flow. Even brief cavitation shortens pump life. Maintain the NPSH margin specified by the manufacturer’s certified curve. If NPSHa is marginal, add a suction booster pump, raise the liquid source, or select a pump with lower NPSHr such as a double-suction or vertical turbine design.
Conclusion
Pump sizing calculation converts process flow requirements and system head into a pump duty point, then selects an impeller and casing that deliver stable, efficient operation across the expected range. The calculation builds a system curve at multiple flows, corrects for fluid properties, verifies NPSH and power margins, and documents every assumption on a sizing data sheet before quotation. Before finalizing the selection, confirm that the pump curve intersects the system curve near best efficiency at design flow, remains within the stable operating envelope at minimum and maximum flow, and meets NPSH requirements at maximum flow with the manufacturer’s required margin. Request certified pump curves and test reports from the manufacturer to verify that the delivered pump matches the calculated duty point.